Introduction
For years I used a copyright sign in a caption of my ggplot2 charts, as most of the fonts I like to use allow to put a copyright sign as a unicode letter (U+00A9). This left me with a need to describe the Creative Commons terms somewhere in a text. Creative Commons provides cosy html badges that can be easily added to Rmarkdown reports.
Some people have strong feelings about using © to designate the open license, as in the past the copyright sign was used to say “Keep your hands off our property”. But this is a correct way, since the Creative Commons licenses are copyright licenses.
Recently I came across an old news saying “from Match 2020 the latest version of the Unicode Standard includes Creative Commons (CC) license symbols” and decided to find out how to use it.
My plan was to check whether I can:
use my favourite Google fonts to add new unicode symbols into ggplot2
use the awesome fonts to add CC signs into ggplot2
use unicode letters in html reports, generated with knit from Rmarkdown).
This post is about what I learned.
Fonts
In the script below some Google fonts and Awesome Fonts are loaded from a local folder on my hard disk (referred as local_font_folder). If you decide to use the code below, you will have to set the correct paths to the font files, saved on your hard disk in advance, or you may try to use (a) sysfonts::font_add_google() or (b) gfonts::download_font().
Show code
showtext_auto()

local_font_folder <- paste0(Sys.getenv("OneDrive"), "/gfonts/")

font_add("RobotoC", regular = paste0(local_font_folder, "RobotoCondensed-Regular.ttf"))

font_add("Sofia",
         regular = paste0(local_font_folder, "SofiaSansCondensed-SemiBold.ttf"),
         bold = paste0(local_font_folder, "SofiaSansCondensed-SemiBold.ttf"))

sysfonts::font_add("fa_brands",
                    regular = paste0(local_font_folder,
                                     "/fontawesome/otfs/Font Awesome 6 Brands-Regular-400.otf"))

# font_add(regular = "C:/W2indows/Fonts/unifont_upper-14.0.01.ttf", family = "Unifont Upper")
# font_add(regular = "C:/Windows/Fonts/cc-icons.ttf", family = "CC Icons")
# font_add(regular = "C:/Windows/Fonts/CCSymbols.ttf", family = "CCSymbols")

my_theme <- theme_void() +
  theme(text = element_text(colour = "white"),
        plot.background=element_rect(fill = "#232323", colour = "#232323"),
        panel.background=element_rect(fill = "#232323", colour = "#232323"),
        plot.margin = unit(c(t=0.2,r=0.2,b=0.2,l=0.2), "cm"),
        plot.title.position = "plot",
        plot.caption.position = "plot")

showtext::showtext_opts(dpi = 192)
(C) symbol in html
This is plain – using © in Rmarkdown will return © in html.
(C) symbol in ggplot2
Simple too – we have to use \U00A9 in geom_text or geom_label, as well as the theme elements (title, subtitle, caption). The cc license terms can be added as text.
Show code
chart <- ggplot(tibble(x = "1", y = "1"), aes(x = x, y = y)) + my_theme

chart +
  geom_label(label="This is label with a \U00A9", size = 10, vjust = 0.5,
             colour = "white", fill = "transparent", label.padding = unit(0.5, "lines")) +
  labs(title = "Using \U00A9 in ggplot2 is easy",
       caption = paste("\U00A9 Rights owner, 2024\n",
                       "CC BY-NC-SA 4.0 Deed\n",
                       "Attribution-NonCommercial-ShareAlike 4.0 International\n",
                       paste("Date: ", format(Sys.time(), '%Y-%m-%d'))))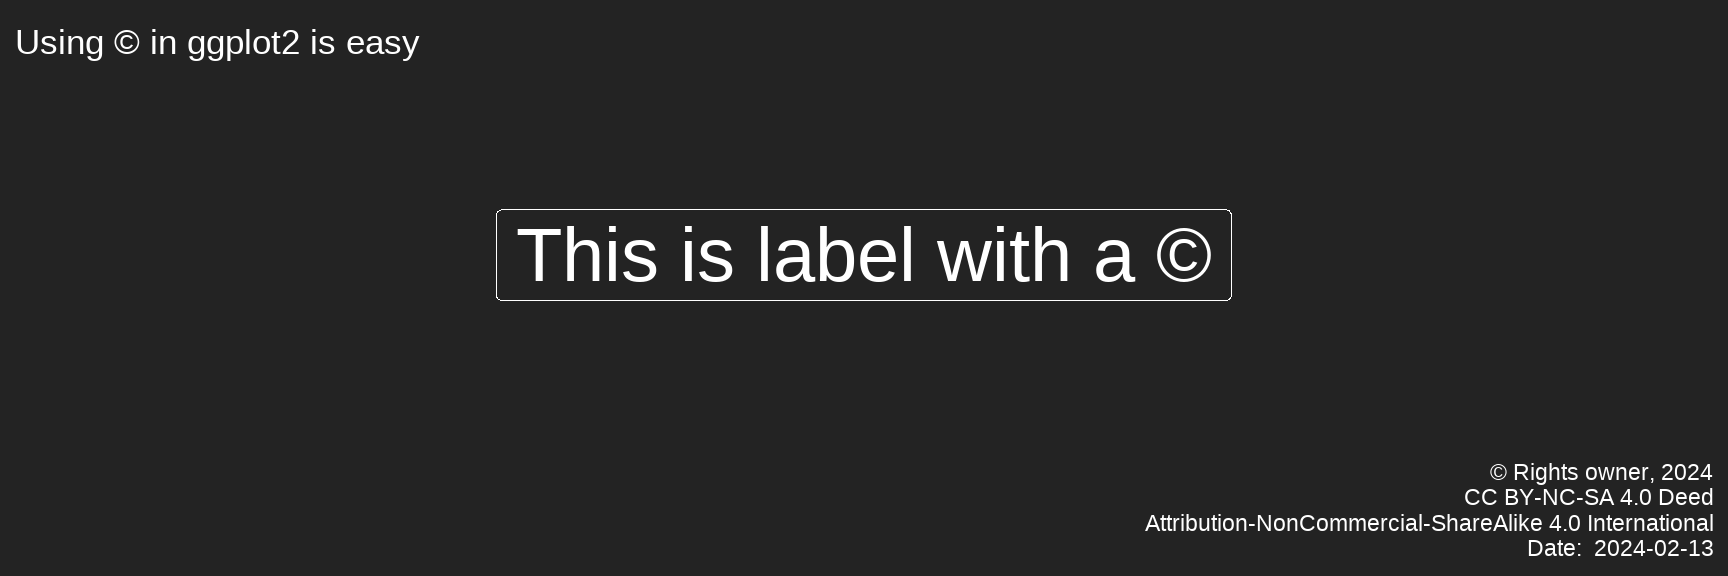
This approach also works with custom fonts, opening a lot of opportunities.
Show code
chart +
  geom_label(label="This is label with a \U00A9", size = 10, vjust = 0.5,
             family = "RobotoC", colour = "white",
             fill = "transparent", label.padding = unit(0.5, "lines")) +
  labs(title = "Using \U00A9 in ggplot2 is easy",
       caption = paste("\U00A9 Rights owner, 2024\n",
                       "CC BY-NC-SA 4.0 Deed\n",
                       "Attribution-NonCommercial-ShareAlike 4.0 International\n",
                       paste("Date: ", format(Sys.Date(), '%Y-%m-%d')))) +
  theme(
    plot.title = element_text(size = 36, hjust = 0, face = "bold", colour = "#ffffff", family = "Sofia"),
    plot.subtitle = element_text(hjust = 0, family = "RobotoC", vjust = 2,
                                              colour = "#ffffff", face = "plain", size = rel(0.7)),
    plot.caption = element_text(hjust = 1, size = rel(0.8), colour = "#827C82")
    )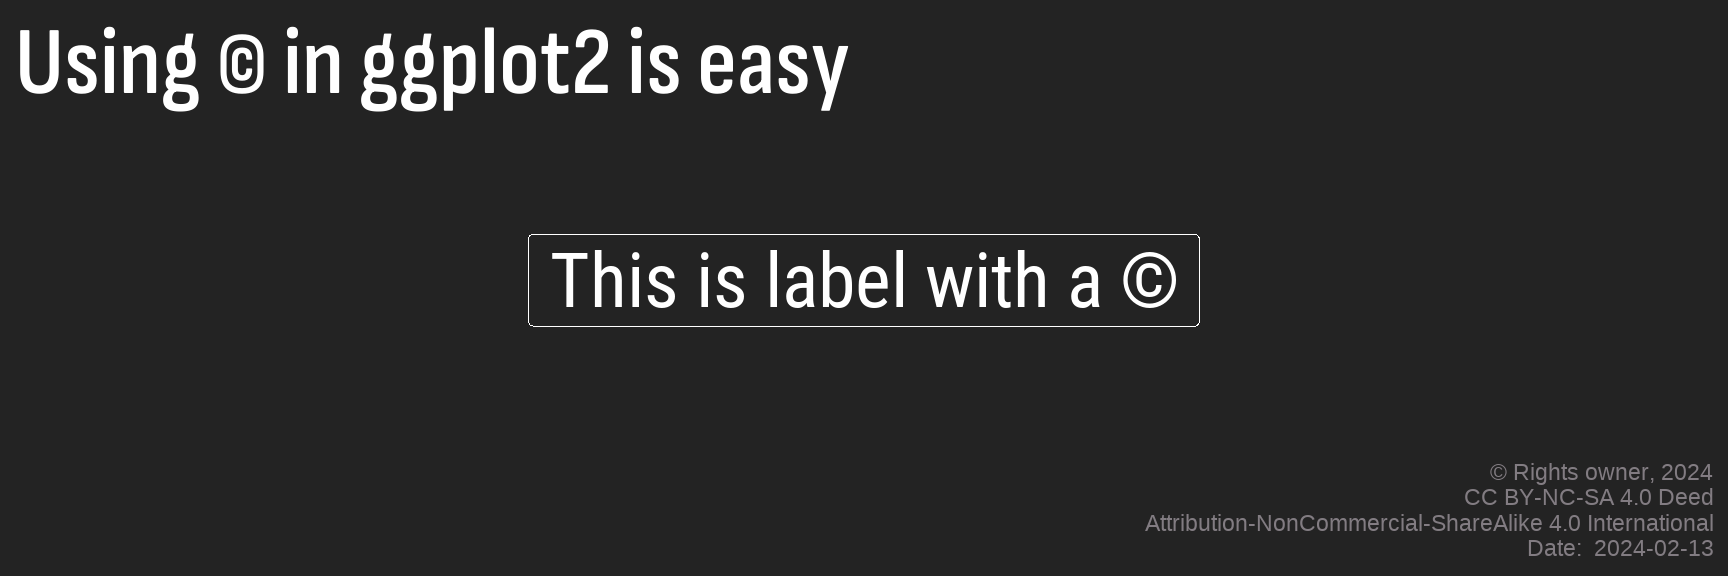
But CC-license terms can take too much space in a caption, so the options we have to consider are eirther to place the terms out of the chart, or use the CC license icons.
CC-snippets in html
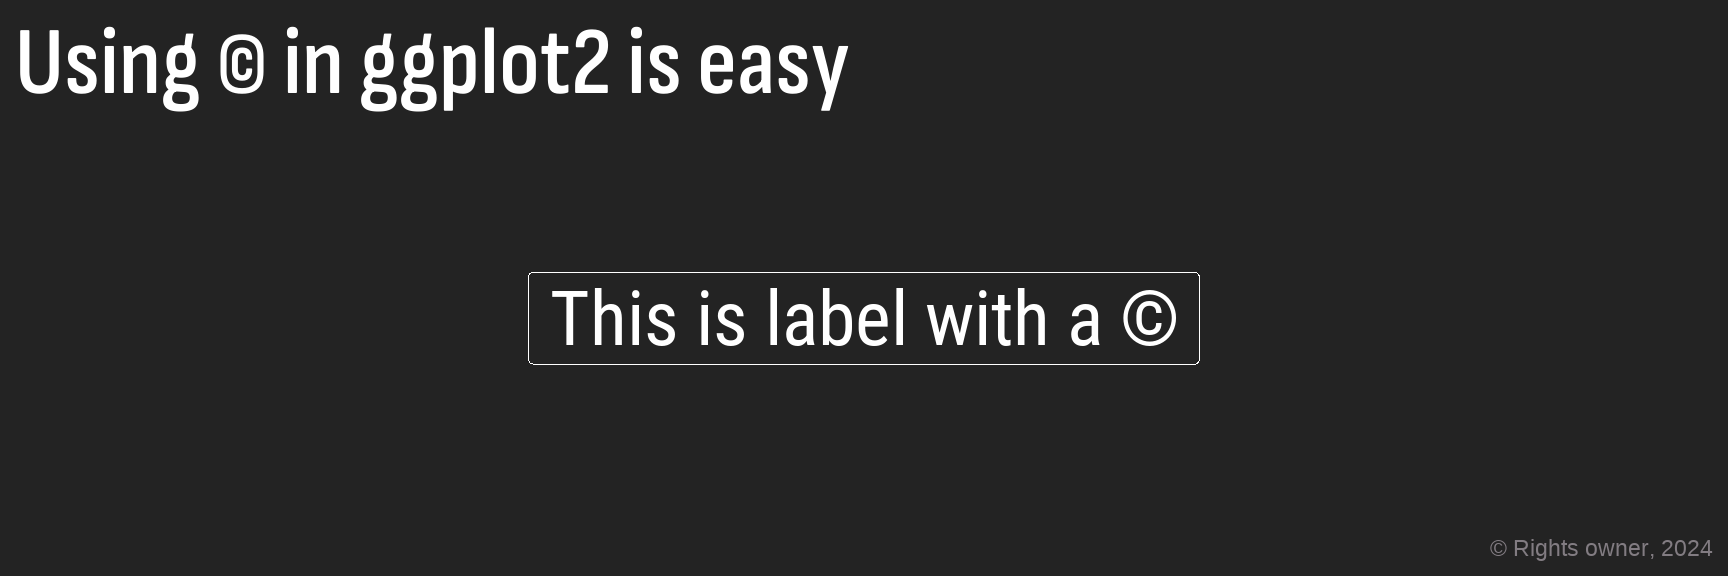
You can generate an HTML snippets at Creative Commons web site and place it next to the image using the figcaption tag. John Allbritten wrote a very informative blog post about the image captions in Rmarkdown. You may see the result below under the chart.
Show code
chart +
  geom_label(label="This is label with a \U00A9", size = 10, vjust = 0.5,
             family = "RobotoC", colour = "white",
             fill = "transparent", label.padding = unit(0.5, "lines")) +
  labs(title = "Using \U00A9 in ggplot2 is easy",
       caption = paste("\U00A9 Rights owner, 2024")) +
  theme(
    plot.title = element_text(size = 36, hjust = 0, face = "bold", colour = "#ffffff", family = "Sofia"),
    plot.subtitle = element_text(hjust = 0, family = "RobotoC", vjust = 2,
                                              colour = "#ffffff", face = "plain", size = rel(0.7)),
    plot.caption = element_text(hjust = 1, size = rel(0.8), colour = "#827C82")
    )
 This work is licensed under a Creative Commons Attribution 4.0 International License.
While this option works fine for a whole HTML document, it is not very practical for the illustrations, as someone willing to re-use the chart will not save the related CC info.
So what about using those special Unicode symbols for Creative Commons licenses?
Unicode CC symbols in html
Using the Unicode symbols for Creative Common licenses in HTML is not as easy as with ©. Placing  (which is a hex representation for a Unicode symbol U+1F16D, corresponding to ) in Rmarkdown will not draw a sign.
This is because its unicode has 5-symbols (1F16D), while unicode for © has only 4 (00A9). The latter belongs to the basic section of the Unicode tables (named Latin-1 Supplement block of Unicode symbols), while the new Unicode symbols (like the ones introduced for CC) belong to the extended part (named Enclosed Alphanumeric Supplement). The only exclusion is ND symbol (its Unicode is U+229C).
The creators of the popular fonts, widely used in the browsers and Office programs, seem to focus on the main symbols of the Unicode Table, so most modern fonts have no graphical representation (a glyph) for Creative Common Unicode symbols. That’s why if you just use  in Rmarkdown, most viewers will not see the proper symbols in HTML output. I apologize if my explanation is not very precise, I am not a computer expert, but this is how I understand this.
And, yes, after few decades of talking and declarat-ing about the Open this and Open that, most users still have the browsers and the fonts that are not quite prepared to show the open licenses.
This table in Wikipedia shows the fonts supporting Supplementary Multilanguage Plane. One of it is a GNU Unifont. Its “upper” companion (ttf, 2Mb) covers significant parts of the Supplementary Multilingual Plane (SMP).
I have also founded few fonts specifically designed to show CC symbols:
CC Icons, created by someone whose nickname on GitHub is richardba . Here is an installation guide.
CCSymbols by Daniel Aleksandersen
In order to use those fonts in Rmarkdown, you have to deal with CSS – set the classes and properly wrap the letters. The tutorials on this I found useful are: 1, 2, 3.
I did not exploit this option, as the same result can be reached with Font Awesome.
Font Awesome in html
Font Awesome Brand Collection contains CC icons – , , , , , not requiring to purchase PRO license.
The fontawesome R package (by Richard Iannone ) makes it very easy to insert Font Awesome icons into R Markdown documents and Shiny apps. The package generates SVG and PNG icons that can be put into Rmarkdown without using internet connection.
Show code
This colored icon is created in Rmarkdown with 'r fa(name = \"creative-commons\", fill = \"steelblue\")'.
The Distill blogs and web sites has a built-in support of Font Awesome, and there is an extension for Quarto, so if you blog, you can just use a syntax like <i class="fab fa-creative-commons"></i> in Rmarkdown.
Font Awesome in ggplot2
Font Awesome icons can also be used in ggplot2 due to the ggtext package that allows to format the text and the theme elements as markdown. See an example below.
Have a nice plotting!
Show code
chartx <- chart +
ggtext::geom_richtext(aes(x = "1", y = "1"),
label= paste0("<span style='font-family:\"Sofia\"; font-size:32pt; color:#82c91e;'>",
"Cool CC Licenses</span><br/>",
"<span style='font-family:\"fa_brands\"; font-size:32pt;'></span>",
"<span style='font-family:\"RobotoC\"; font-size:32pt;'> = \\<br/>",
"<span style='font-family:\"fa_brands\"; font-size:32pt;'></span>",
"<span style='font-family:\"RobotoC\"; font-size:32pt; '> = \\<br/>",
"<span style='font-family:\"fa_brands\"; font-size:32pt;'></span>",
"<span style='font-family:\"RobotoC\"; font-size:32pt; '> = \\</span>"),
vjust = 0.5, colour = "white", fill = NA,
label.padding = unit(c(0.5, 0.5, 0.5, 0.5), "lines"),
label.r = unit(0.25, "lines")) +
ggtext::geom_richtext(aes(x = "2", y = "1"),
label= paste0("<span style='font-family:\"Sofia\"; font-size:32pt; color:#fcc419;'>",
"Restrictive CC Licenses</span><br/>",
"<span style='font-family:\"fa_brands\"; font-size:32pt;'></span>",
"<span style='font-family:\"RobotoC\"; font-size:32pt;'> = \\<br/>",
"<span style='font-family:\"fa_brands\"; font-size:32pt;'></span>",
"<span style='font-family:\"RobotoC\"; font-size:32pt; '> = \\<br/>",
"<span style='font-family:\"fa_brands\"; font-size:32pt;'></span>",
"<span style='font-family:\"RobotoC\"; font-size:32pt; '> = \\</span>"),
vjust = 0.5, colour = "white", fill = NA,
label.padding = unit(c(0.5, 0.5, 0.5, 0.5), "lines"),
label.r = unit(0.25, "lines")) +
labs(title = paste0("<span style='font-family:\"fa_brands\"; font-size:40pt;'></span>",
"<span style='font-family:\"Sofia\"; font-size:40pt;'>",
" license icons are possible in ggplot2 charts</span>"),
subtitle = paste0("<span style='font-family:\"RobotoC\"; font-size:25pt;'>",
"Custom styling is possible due to ggtext package </span>",
"<span style='font-family:\"fa_brands\"; font-size:25pt; color:#4facf7;'> </span>",
"<span style='font-family:\"fa_brands\"; font-size:25pt; color:#D55E00;'></span>"),
caption = paste0("<span style='font-family:\"fa_brands\"; font-size:15pt;'></span>",
"<span style='font-family:\"RobotoC\"; font-size:15pt;'>",
" ConviviaR Tools, 2024<br/>",
"https:\\/\\/dwayzer.netlify.app<br/>",
"The CC symbols are introduced with the Awesome Fonts<br/>",
paste0("Date: ", format(Sys.Date(), '%Y-%m-%d'),"</span>"))) +
theme(
plot.title = element_markdown(halign = 0, hjust = 0, face = "bold", colour = "#ffffff"),
plot.subtitle = element_markdown(halign = 0, hjust = 0, vjust = 2,
colour = "#ffffff", face = "plain", size = rel(1.2)),
plot.caption = element_markdown(halign = 1, hjust = 1, size = rel(0.8), colour = "#827C82")
)
dir_charts <- paste0(getwd(), "/images/")
if(!dir.exists(dir_charts)){ dir.create(dir_charts) }
if(!file.exists(paste0(dir_charts, "cc_in_ggplot.png"))){
ggplot2::ggsave(filename = paste0(dir_charts, "cc_in_ggplot.png"),
plot = chartx,
height = 6, width = 9, units = "cm", dpi = 300)
}
chartx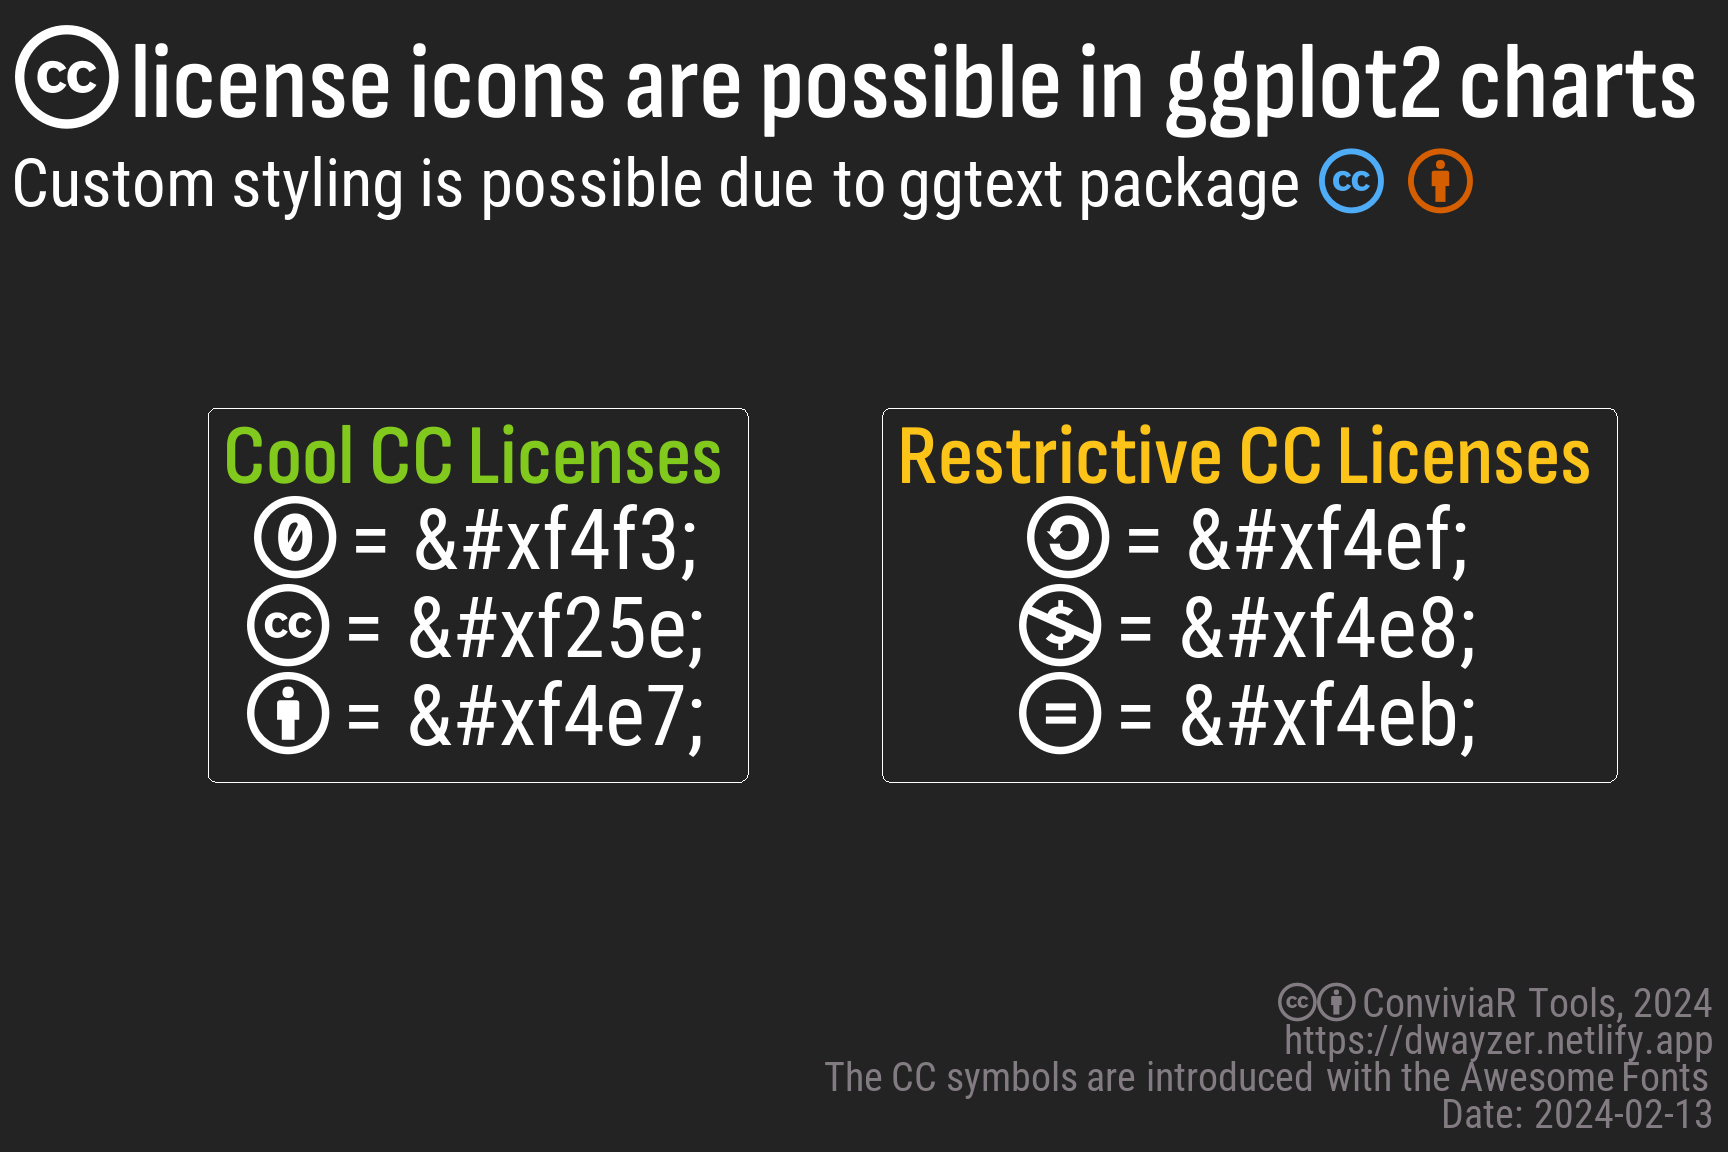
Acknowledgments
Allaire J, Xie Y, Dervieux C, McPherson J, Luraschi J, Ushey K, Atkins A, Wickham H, Cheng J, Chang W, Iannone R (2023). rmarkdown: Dynamic Documents for R. R package version 2.22, https://github.com/rstudio/rmarkdown.
Iannone R (2023). fontawesome: Easily Work with ‘Font Awesome’ Icons. R package version 0.5.2, https://CRAN.R-project.org/package=fontawesome.
Qiu Y, details. aotifSfAf (2022). sysfonts: Loading Fonts into R. R package version 0.8.8, https://CRAN.R-project.org/package=sysfonts.
Qiu Y, details. aotisSfAf (2023). showtext: Using Fonts More Easily in R Graphs. R package version 0.9-6, https://CRAN.R-project.org/package=showtext.
Wickham H (2016). ggplot2: Elegant Graphics for Data Analysis. Springer-Verlag New York. ISBN 978-3-319-24277-4, https://ggplot2.tidyverse.org.
Wilke C, Wiernik B (2022). ggtext: Improved Text Rendering Support for ‘ggplot2’. R package version 0.1.2, https://CRAN.R-project.org/package=ggtext.
Xie Y (2023). knitr: A General-Purpose Package for Dynamic Report Generation in R. R package version 1.43, https://yihui.org/knitr/.
Xie Y (2015). Dynamic Documents with R and knitr, 2nd edition. Chapman and Hall/CRC, Boca Raton, Florida. ISBN 978-1498716963, https://yihui.org/knitr/.
Xie Y (2014). “knitr: A Comprehensive Tool for Reproducible Research in R.” In Stodden V, Leisch F, Peng RD (eds.), Implementing Reproducible Computational Research. Chapman and Hall/CRC. ISBN 978-1466561595.
Xie Y, Allaire J, Grolemund G (2018). R Markdown: The Definitive Guide. Chapman and Hall/CRC, Boca Raton, Florida. ISBN 9781138359338, https://bookdown.org/yihui/rmarkdown.
Xie Y, Dervieux C, Riederer E (2020). R Markdown Cookbook. Chapman and Hall/CRC, Boca Raton, Florida. ISBN 9780367563837, https://bookdown.org/yihui/rmarkdown-cookbook.